ページ

2016年6月11日土曜日

機械学習のフレームワークTensorflowを試す 5 - データフローグラフを可視化(TensorBoard) -


前回やった配列[3, 4, 5]の2乗した値の平均値を算出するデータフローグラフを
可視化してみたいと思います。
可視化するに当たってTensorBoardというツールを使用します。
Tensorflowをインストールすると使えます。
基本的な使い方は
$ tensorboard --logdir=<ログディレクトリのパス>
として実行し、ブラウザでhttp://0.0.0.0:6006にアクセスすると
可視化されたものが見られます。

可視化する為にコード修正

まずは修正前のコードです。
# coding: UTF-8
import tensorflow as tf

array = tf.constant([3,4,5])
square = tf.square(array)
reduce = tf.reduce_mean(square)
sess = tf.Session()
ret = sess.run(reduce)
print(ret) # => 16
このコードを可視化する為にちょこっと修正します。
# coding: UTF-8
import tensorflow as tf

array = tf.constant([3,4,5])
square = tf.square(array)
reduce = tf.reduce_mean(square)
sess = tf.Session()
ret = sess.run(reduce)
# 以下の行を追加
tf.train.SummaryWriter('report', sess.graph)
print(ret) # => 16
tf.train.SummaryWriterクラスを作成する行を追加のしています。
上では第一引数でイベントファイルを出力するディレクトリ名を、
第二引数でセッションのグラフを渡しています。
今回は単純にグラフを表示させるだけです。

TensorBoardで確認

修正したコードを実行するとreportディレクトリが作られているかと思います。
--logdirにreportディレクトリのパスを指定してTensorBoardを起動してみます。
↓ブラウザでアクセスしGRAPHのタグを表示させた結果です。

それっぽいのが表示されています。
丸が定数のノードで、楕円が計算処理を行うノードです。
次に各ノードをクリックして詳細を見てみます。
まずはConstつまりは配列の[3,4,5]です。クリックすると

右上に詳細が表示されています。Attributesにデータ型と値が確認できます。
次はSquareをクリックしてみます。二乗の計算処理を行うノードです。

Inputが先ほどのConstでOutputがRankMeanとなっています。
Meanは最終的な平均値を求める計算処理を行うノードというのは想像できるんですが、 他のRankrangeは、、?
調べてみると、
tf.reduce_meanは引数としてreduction_indiceskeep_dims
の引数を与えることができるようです。
例)
>>> import tensorflow as tf
>>> array = tf.constant([[3.,4.],[5.,6.],[7.,8.]])
>>> reduce = tf.reduce_mean(array)
>>> reduce0 = tf.reduce_mean(array, 0)
>>> reduce1 = tf.reduce_mean(array, 1)
>>> sess = tf.Session()
>>> ret = sess.run(reduce)
>>> ret0 = sess.run(reduce0)
>>> ret1 = sess.run(reduce1)
>>> print(ret)
5.5
>>> print(ret0)
[ 5.  6.]
>>> print(ret1)
[ 3.5  5.5  7.5]
tf.reduce_meanの第二引数で渡しているreduction_indicesの値が
何も指定しない場合は、 (3 + 4 + 5 + 6 + 7 + 8) / 6 = 5.5となります。
0の場合、(3, 5, 7), (4, 6, 8)の平均値を求めます。
(3 + 5 + 7) / 3 = 5(4 + 6 + 8) / 3 = 6
1の場合、(3, 4)、(5, 6), (7, 8)の平均値を求めます。
(3 + 4) / 2 = 3.5(5 + 6) / 2 = 5.5(7 + 8) / 2 = 7.5
どういった平均を求めるか設定してるようです。

今回のサンプルではreduction_indicesに値を
設定していない為、[9,16,25](square)(9 + 16 + 25) / 3 = 16.66...
として計算されています。
Ranktf.rankという次元数を求めるもので、rangetf.rangeという
その名の通り範囲を求めるものです。
reduction_indicesを指定しなかった場合のみ表示されるので、
tf.ranktf.rangeの結果を内部で使っているのではないか・・・と思います。

具体的にここで使ってる!!というのを見つけたかったのですが今回はここまで。

2016年6月8日水曜日

いつものアラートに飽きた時のオシャレなアラート Sweet Alert iOS


iOSにしてもAndroidにしても標準のアラートは味気ないものです。。
今回はそんな味気ない標準のアラートをシャレたアラートにしてくれる
Sweet Alert iOSを使ってみます。

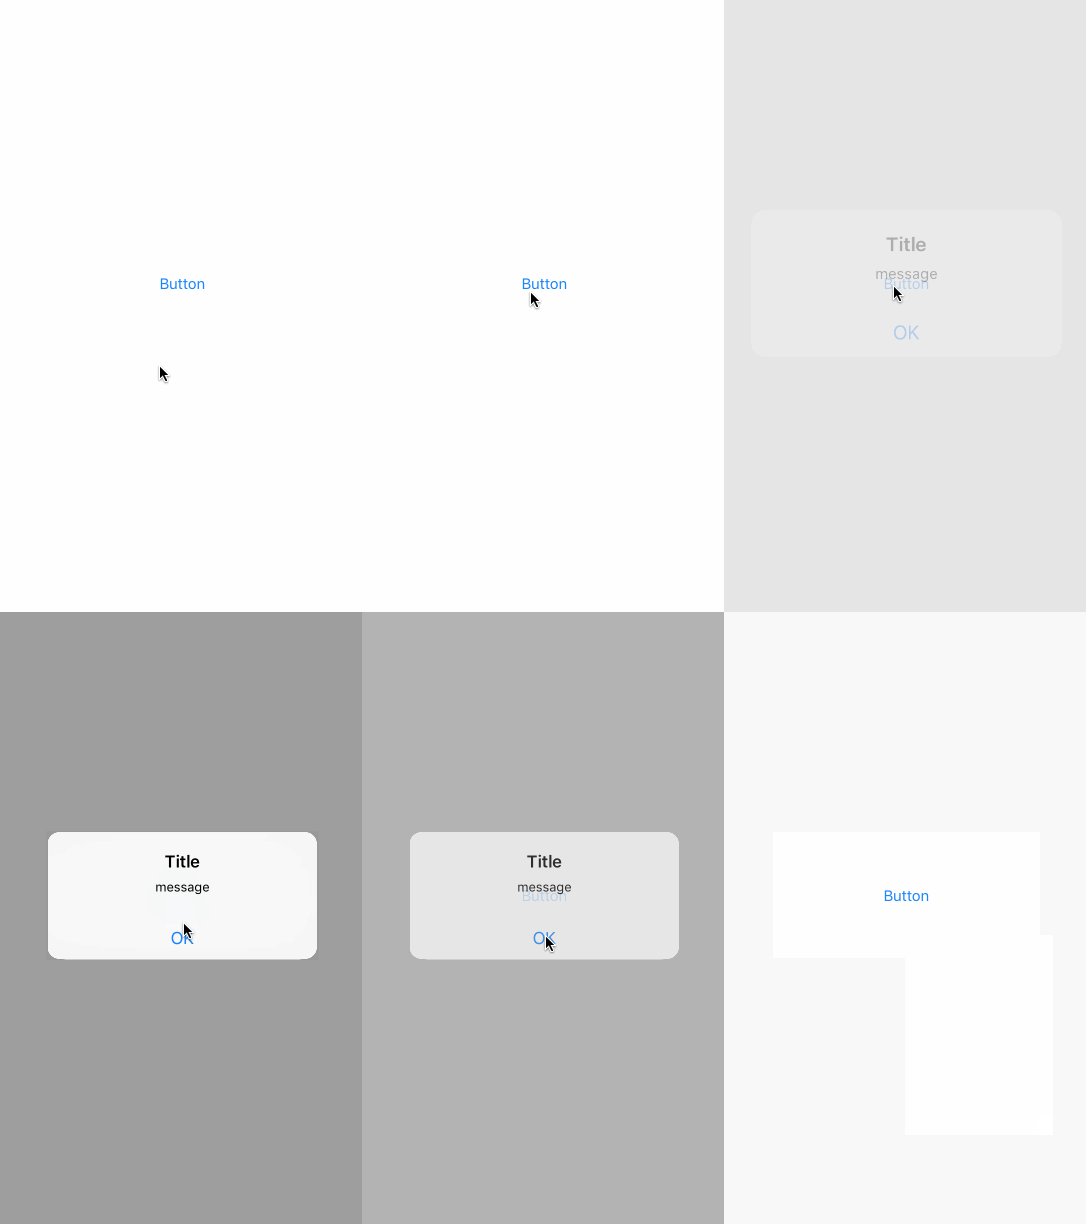
標準のアラート

まずは標準のアラートです。
sweet_alert_1
はい、いたってシンプルです。

メッセージのみ

ではSweet Alert iOSを使ってアラートを表示させてみます。
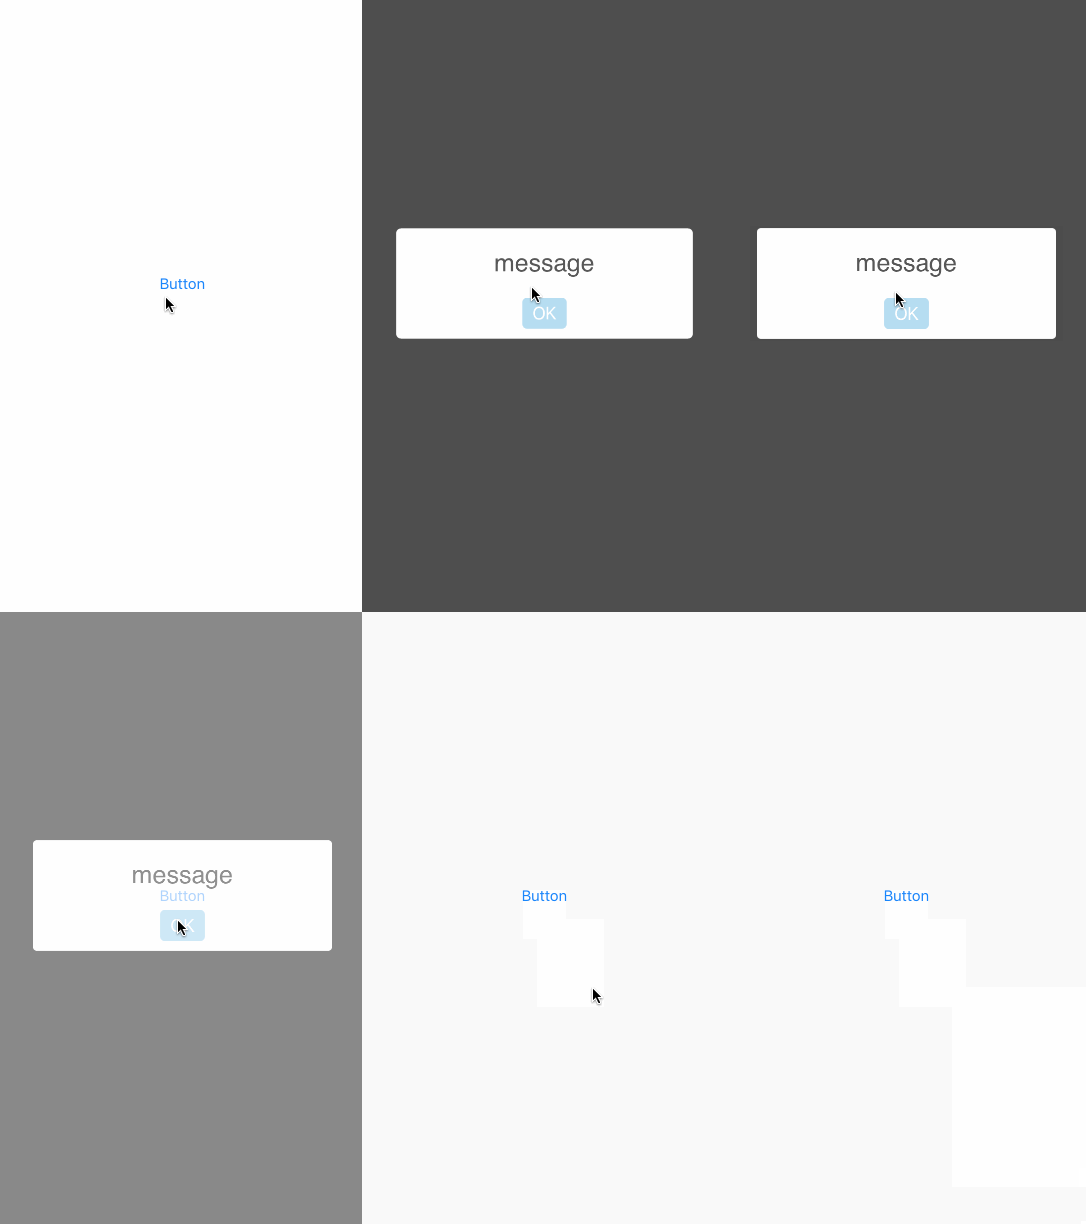
まずはシンプルなメッセージのみのアラート
SweetAlert().showAlert("message")
sweet_alert_2
表示する時にアニメーションが付いてリッチな感じです。

タイトル + Success

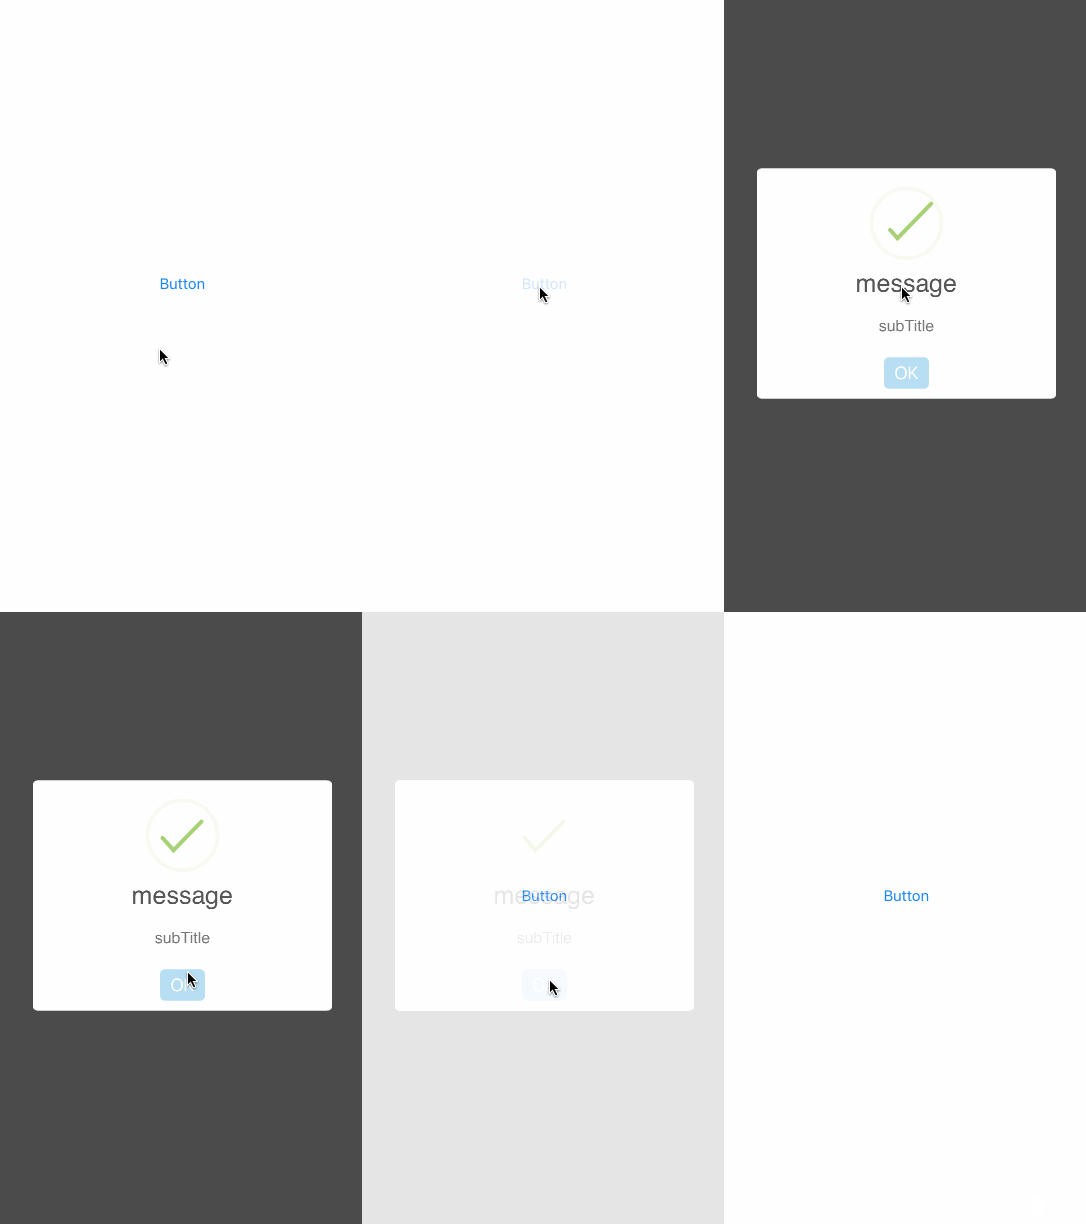
次はアラートにタイトルを付け、Successのアラートスタイルで表示させてみます。
SweetAlert().showAlert("message", subTitle: "subTitle", style: AlertStyle.Success)
sweet_alert_3
アラートスタイルはenumで定義されており、
  • Success
  • Error
  • Warning
  • None
  • CustomImag(imageFile:String)
の5種類が設定できます。格段オシャレになりました。

ボタンイベント

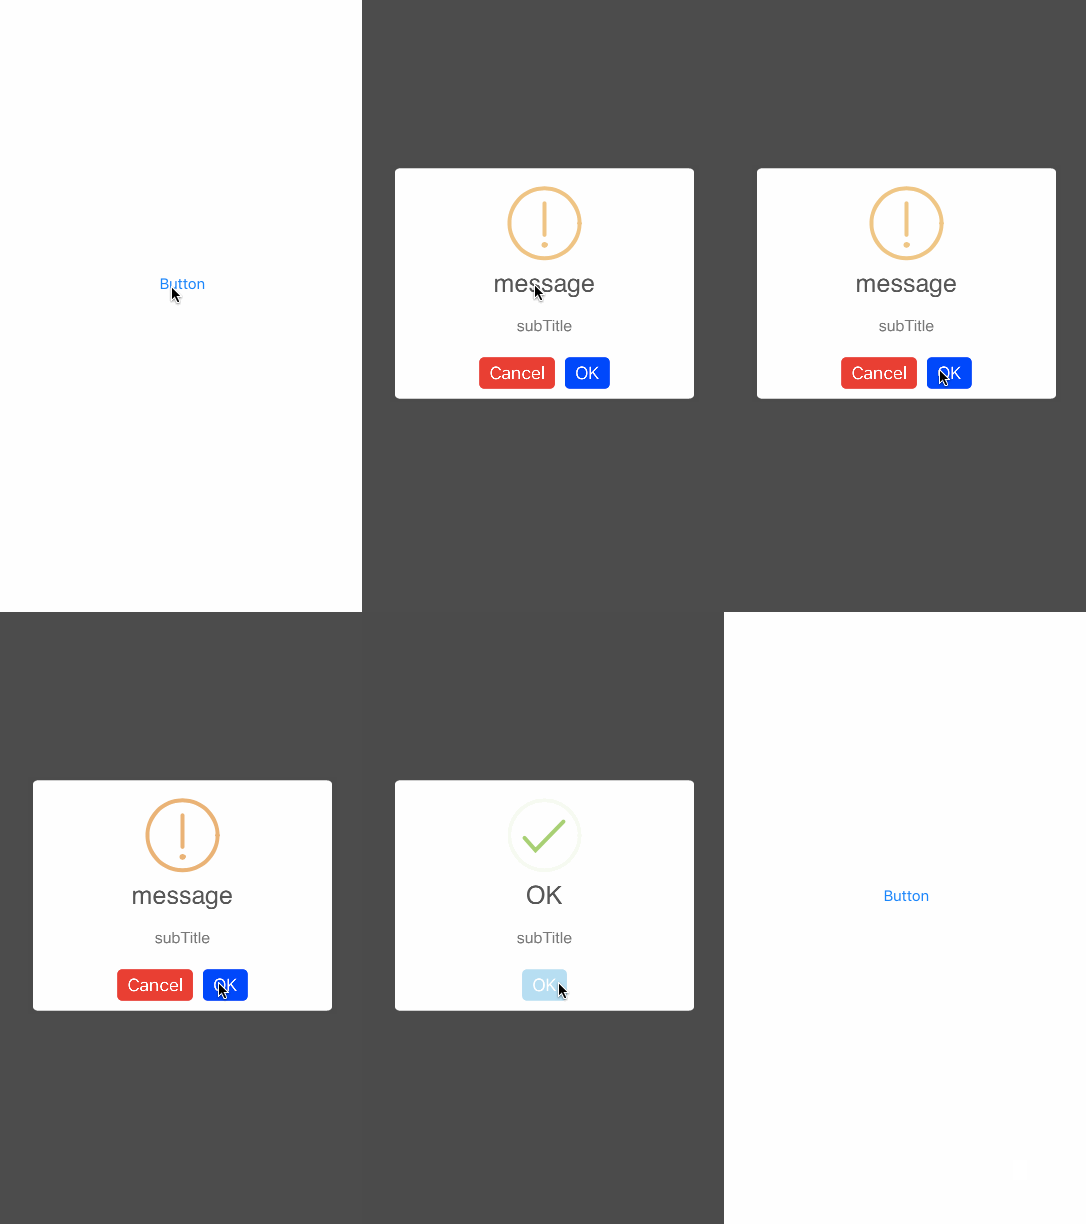
最後にアラートにカスタムボタンを表示されてみます。
SweetAlert().showAlert("message", subTitle: "subTitle", style: AlertStyle.Warning, buttonTitle:"Cancel", buttonColor:UIColor.redColor() , otherButtonTitle: "OK", otherButtonColor: UIColor.blueColor()) { (isOtherButton) -> Void in
    if isOtherButton == true {

        print("Cancel Button Pressed")
    }
    else {
        SweetAlert().showAlert("OK", subTitle: "subTitle", style: AlertStyle.Success)
    }
}
sweet_alert_4
OKボタンが押されると別のアラートを表示させています。
アラート一つで雰囲気が全然変わりますね〜。


2016年6月5日日曜日

道の駅を巡ってみる 12 - 手打ちそばが美味しい 耶馬トピア -


今回は大分県の中津市にある道の駅「耶馬トピア」です。
「やぱトピア」と読むらしいです。

ここはそばづくしの道の駅で、そば打ち体験などもできるようです。


奥に進んでいくと食事処が。当然おそばをいただきました^^


注文したのは山かけ肉そばです。
そばが手打ちだけあって美味しいのは当然ですが、とろろも粘りが強く
甘辛い味付けの肉とマッチしていてとても美味しかったです^^。

また、ここの道の駅が自然に囲まれたような道の駅で、
とてもゆっくりとした時間を過ごせるようなところでした。


関連ページ


2016年6月1日水曜日

機械学習のフレームワークTensorflowを試す 4 - データフローグラフを理解する -


前回のサンプルコードでは事前に計算する方法を定義して、
最後に実際の計算を行ってました。
これこそがデータフローグラフの形になります。
データフローはデータの流れです。ではグラフはというとデータ構造になります。

上の図のように、ノードとそのノード間を連結するエッジで構成されます。
ノードとノードの繋がり方に着目したものになります。

Tensorflowのデータフローグラフ

Tensorflowではノードを計算操作(Operation)としています。
そしてノードが扱うデータ形式が前回も出てきたテンソル(Tensor)になります。
ここで例えば、配列[3, 4, 5]の2乗した値の平均値を算出してみます。
通常のプログラムだと・・
[3, 4, 5].map { |v| v *v }.inject(:+) / 3
# => 16
上のように、全ての要素を2乗し合計したものを要素数3で割って算出しています。
これをTensorflowで計算させると・・
$ python
>>> import tensorflow as tf
>>> array = tf.constant([3,4,5])
>>> square = tf.square(array)
>>> reduce = tf.reduce_mean(square)
>>> sess = tf.Session()
>>> ret = sess.run(reduce)
>>> print(ret)
16
上の例でのノードはarraysquarereduceになります。
[3,4,5]のデータは各ノードを通り、最終的に計算された値が出力されます。

セッション

実際に計算を行う為にTensorflowではセッションを作成します。
sess = tf.Session()
runメソッドにノードを渡すことで対象のノードを計算します。
sess.run(reduce)
ちなみに上のarraysquarereduceの各ノードを実行させると・・
$ python
>>> sess = tf.Session()
>>> array = tf.constant([3,4,5])
>>> ret = sess.run(array)
>>> print(ret)
[3 4 5]
>>> square = tf.square(array)
>>> ret = sess.run(square)
>>> print(ret)
[ 9 16 25]
>>> reduce = tf.reduce_mean(square)
>>> ret = sess.run(reduce)
>>> print(ret)
16
となり、各ノード毎の計算が行なわれているのが確認できているかと思います。

2016年5月28日土曜日

HTML5のCanvasでimgとcanvasを重ねて拡大鏡を作る


最近、HTML5のCanvas上で拡大鏡を作ることがあったのでそのメモです。

完成イメージ


まずは、完成イメージ↓
gif
マウスの動きに合わせて拡大鏡が動きます。

実装


土台となるhtmlですが、imgの上にcanvasのレイヤーを重ねてます。
重ねる為imgにはz-index: 1;canvasにはz-index: 2;を指定し、
Z方向の位置を設定しています。
  • index.html
<!DOCTYPE html>
<html>
<head>
  <meta charset="utf-8">
  <title>loupe</title>
  <script type="text/javascript" src="canvas_loupe.js"></script>
  <script type="text/javascript" src="index.js"></script>
  <style>
    #container {
      position: relative;
    }
    #main_img {
      width: 640px;
      height: 480px;
      position: absolute;
      z-index: 1;
    }
    #loupe_canvas {
      position: absolute;
      z-index: 2;
    }
  </style>
</head>
<body>
  <div id="container">
    <img id="main_img" src="sample.jpg"></img>
    <canvas id="loupe_canvas" width="640" height="480"></canvas>
  </div>
</body>
</html>
次に実際の拡大鏡の処理を行うcanvas_loupe.jsです。
  • canvas_loupe.js
/**
 * canvas_loupe.js
 */

var loupe = {

  x: 0, // Current x.
  y: 0, // Current y.
  w: 0, // Image width.
  h: 0, // Image height.
  loupe_x: 50, // loupe x coordinate.
  loupe_y: 50, // loupe y coordinate.
  size: 50, // Crop size.
  zoom: 2, // Zoom rate.
  wide_size: 0, // Crop size * Zoom rate.
  image: null, // Image object.
  /**
   * Initialize.
   *
   * @param w Image width
   * @param h Image height
   * @param src Image src
   */
  initialize: function(w, h, src) {
    this.w = w;
    this.h = h;
    this.wide_size = this.size * this.zoom;
    this.image = new Image();
    this.image.src = src;
  },
  /**
   * Update coordinate.
   *
   * @param x
   * @param y
   */
  update: function(x, y) {
    this.x = x;
    this.y = y;
  },
  /**
   * Draw loupe.
   *
   * @param ctx context
   */
  draw: function(ctx) {

    var nx = (this.x * this.image.naturalWidth / this.w) - (this.size / 2);
    var ny = (this.y * this.image.naturalHeight / this.h) - (this.size / 2);

    ctx.save();
    ctx.beginPath();
    ctx.arc(this.loupe_x + this.wide_size / 2,
      this.loupe_y + this.wide_size / 2, this.wide_size / 2, 0, Math.PI * 2, false);
    ctx.clip();

    ctx.drawImage(this.image, nx, ny, this.size, this.size,
      this.loupe_x, this.loupe_y, this.wide_size, this.wide_size);
    ctx.restore();
  }
};
やってる事としては、、
  • initialize
    画像のsrcと画像の幅、高さを引数で渡して、メンバに保存してます
  • update
    x,yの座標位置(マウスの位置)を更新しています。
  • draw
    描画を行っている箇所です。まず
    var nx = (this.x * this.image.naturalWidth / this.w) - (this.size / 2);
    var ny = (this.y * this.image.naturalHeight / this.h) - (this.size / 2);
    ↑で実際の画像サイズと表示サイズを元に拡大鏡の描画位置を算出しています。
    次にclipを使って拡大鏡の丸い形でくり抜く処理を行ってます
    ctx.beginPath();
    ctx.arc(this.loupe_x + this.wide_size / 2,
      this.loupe_y + this.wide_size / 2, this.wide_size / 2, 0, Math.PI * 2, false);
    ctx.clip();
    最後に拡大した画像を表示させています。
    ctx.drawImage(this.image, nx, ny, this.size, this.size,
      this.loupe_x, this.loupe_y, this.wide_size, this.wide_size);
    先にくり抜く形を指定しclipしてからdrawImageすると指定した
    形で画像がくり抜かれて描画されます。
最後に拡大鏡の呼び出しやマウス位置更新の処理を行っているindex.jsです。
  • index.js
var ctx = null;

window.onload = function() {
  var canvas = document.getElementById('loupe_canvas');
  ctx = canvas.getContext('2d');

  canvas.addEventListener('mousemove', onMouseMove);
  loupe.initialize(640, 480, 'sample.jpg');

};

function onMouseMove(e) {
  loupe.update(e.clientX, e.clientY);
  loupe.draw(ctx);
}
マウス移動時onMouseMoveloupeを呼び出しています。